

How to Build Live Operational Dashboards for Real-Time Reporting

Operating a modern digital enterprise using weekly or monthly PDF reports is the operational equivalent of flying blindly. When critical performance indicators sit trapped inside isolated databases, leadership teams must rely on intuition rather than verified facts. Delays in recognizing production bottlenecks, inventory shortfalls, or spikes in user acquisition costs lead directly to wasted operational capital and missed revenue targets.
A live operational dashboard eliminates these technical blind spots by capturing, processing, and rendering operational events as they happen. Unlike static analytics tools that look back at historical periods, real-time dashboard engines turn active system processes into clear visual metrics. Building this infrastructure enables teams to identify anomalies immediately, optimize resource allocation instantly, and make definitive strategic decisions based on accurate data.
Architectural Foundations of Real-Time Pipelines
Constructing a live reporting network requires shifting away from legacy database architectures. Traditional platforms rely heavily on batch processing, where data accumulates over hours before running intensive extraction scripts. This legacy methodology creates noticeable system lag and strains primary transaction engines during periods of peak user activity.
A live dashboard relies instead on event-driven architecture. Every user action—such as completing a digital purchase, filling out a form, or logging an internal tracking event—creates an isolated data payload. This package transmits instantly through optimized streams to a visualization backend, avoiding the delays common in older batch setups.
To prevent high-volume tracking streams from slowing down primary customer systems, developers split the ingestion logic away from the core transactional environment. The front-end application sends structured payloads directly to an independent ingestion hub. This separation ensures that thousands of concurrent analytical queries can run without interrupting standard checkout pipelines or user operations.
+-----------------------------------+
|    CLIENT LAYER / WEB INTERFACE   |
+-----------------+-----------------+
                  |
                  v (WebSocket Pipe)
+-----------------------------------+
|     INGESTION & MESSAGE QUEUE     |
+-----------------+-----------------+
                  |
         +--------+--------+
         v                 v
+-----------------+ +---------------+
|  READ REPLICA   | |WORKFLOW ENGINE|
+--------+--------+ +---------------+
         |
         v
+-----------------------------------+
|   LIVE OPERATIONAL DASHBOARD VIEW |
+-----------------------------------+
Technical Matrix: Analytical Reporting Paradigms
Selecting the right reporting layer requires understanding the core differences between static data sets and continuous, event-driven streams. Using basic tools for high-velocity monitoring creates system bottlenecks, while complex event engines are unnecessary for simple monthly accounting tasks.
The matrix below outlines how data freshness and pipeline engineering change across different operational architectures:
| Architectural Metric | Legacy Batch Processing | Polling Infrastructure | Live Event Streaming |
|---|---|---|---|
| Data Update Latency | 24 to 48 hours minimum. | 5 to 15 minute intervals. | Sub-second event sync. |
| Database Compute Load | High intermittent peaks. | Continuous repetitive stress. | Low, evenly distributed load. |
| Network Overhead | Low bandwidth cost. | Extremely high request waste. | Highly optimized stream pipelines. |
| Primary Structural Node | Direct SQL extraction. | Scheduled API requests. | Webhooks & sockets. |
| Operational Intent | Historical audit reviews. | Status updates. | Live monitoring. |

Engineering the Data Ingestion Layer
Deploying Event-Driven Ingestion Channels
The front-end pipeline must capture system events without introducing user-facing latency. Relying on continuous server polling creates massive network overhead, as hundreds of dashboard clients repeatedly ask the database for new logs. This approach quickly exhausts server memory allocations and causes page slowdowns during high-traffic events.
Bypassing these limitations requires building direct webhook triggers and stream ingestors that push data events only when they happen. Designing these channels correctly allows your applications to pipe clean information packages directly into analytical layers. You can see how this differs from standard database extraction models by exploring the ultimate guide to custom webhooks: speed, security, and why they outperform polling, which outlines the underlying physics of modern real-time data movement.
Programmatic Validation and Memory Allocation
Raw operational payloads must be verified before hitting the visualization layer. A payload containing incomplete arrays can break front-end charting scripts, rendering the dashboard useless. The ingestion engine checks incoming packages against predefined schemas. Valid packages drop into high-speed memory caches like Redis before writing to permanent storage, enabling instant visual updates without forcing the primary database to read from disk continuously.
Streamlining Visual Data for the Operations Matrix
Eliminating Cognitive Noise via Granular UI Design
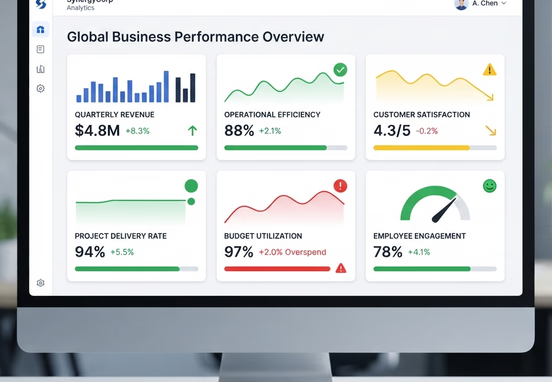
Placing too many data points onto a single display view makes it difficult for operators to identify actual business issues. Effective dashboard design focuses strictly on high-leverage metrics tailored to specific organizational roles. A warehouse manager requires logistics volumes and sorting logs, whereas a marketing controller needs visibility into acquisition anomalies and form interactions.
- Metric Isolation: Keep views focused on fewer than seven core metrics to minimize cognitive overload.
- Status Indication: Use color variables like green, yellow, and red to highlight performance boundary updates.
- Contextual Scales: Include historical baselines so operators see instantly if a current metric is unusual.
- Interactive Drill-Downs: Design metrics so users can click to view underlying database logs without leaving the dashboard layout.
Implementing Persistent Front-End Communication Layers
Rendering real-time metrics without manual browser refreshes requires a persistent connection between client browser and server. Standard HTTP protocols close the loop after loading a page, forcing users to click reload. Modern setups run on WebSockets or Server-Sent Events (SSE) to keep a lightweight communication pipe open continuously. When a new event is ingested, the server pushes updated data through this pipe, updating charts smoothly without a full page reload.
Governance, Scalability, and Optimization Principles
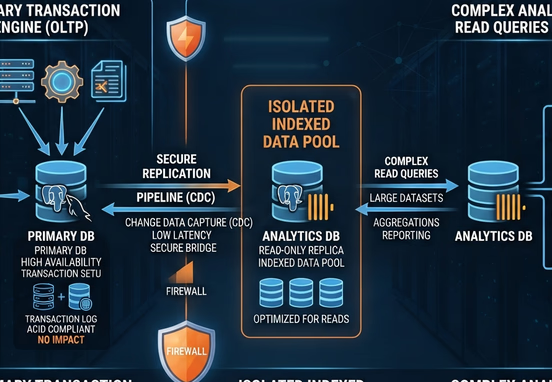
Infrastructural Optimization Tip: Never connect live dashboard visualizations directly to your primary production database. Running complex analytical queries against the same tables used for customer transactions will slow down your checkout system. Always build indexed read replicas or dedicated time-series data storage pools designed specifically for high-speed dashboard searches.
Maintaining operational clarity also requires connecting these live dashboards to your wider back-office tech stack. A standalone dashboard becomes far more valuable when integrated into a unified data network. By feeding these real-time streams into a centralized web data hub that supports executive decision-making, leadership teams can see exactly how day-to-day operations impact long-term corporate goals.
Furthermore, these systems must remain highly resilient during traffic spikes. Ensuring your dashboards remain functional requires deploying the bulletproof web pipeline with custom error controls and smart fallbacks to handle operational anomalies safely behind the scenes.
Deploying Enterprise-Grade Real-Time Systems
Transforming corporate reporting from slow, historical reviews into a real-time operational tool requires customized technical execution. Relying on basic dashboard templates or third-party tracking widgets introduces rigid limitations, high monthly fees, and security vulnerabilities. These generic tools frequently struggle to connect with legacy databases or scale cleanly alongside your business growth.
True operational leverage comes from building tailored, high-performance data infrastructure engineered specifically around your day-to-day business processes. Working directly with specialized developers to deploy a bespoke workflow and systems automation platform allows you to create highly optimized data streams. This architecture ensures your dashboards integrate seamlessly with your core systems, providing the clear insight needed to manage resources efficiently and scale operations with absolute certainty.
By connecting your software tools into an optimized real-time reporting framework, your organization eliminates manual spreadsheet collection entirely. Real-time data visualization helps teams spot operational issues early, keep back-office systems fully aligned via an optimized two-way data sync architecture, and give leadership teams the accurate data required to outpace competitors.