

How to Track Your Customer Journey From Discovery to Final Purchase
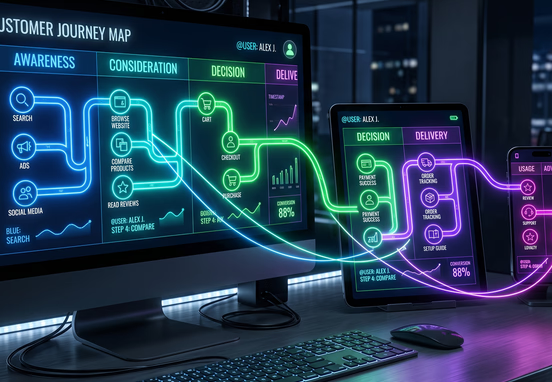
Many business operators evaluate their sales pipelines using a simplistic, linear model. They assume a user performs a singular search query, clicks an organic link, views a product or service page, and completes a transaction. In the modern digital ecosystem, this direct pathway is exceptionally rare. A modern user journey is highly fragmented, multi-device, and non-linear, spanning multiple sessions, varied traffic channels, and prolonged consideration windows before a conversion event occurs. Furthermore, relying on third-party landing hubs can disrupt this tracking entirely; prioritizing a custom website experience instead of standard link-in-bio tools is essential to avoid sending your hard-earned traffic to external platforms before users even enter your primary funnel.
If you are only measuring the final interaction that triggers a conversion, you are operating with a massive blind spot in your marketing allocation. This mistake causes companies to over-fund bottom-of-funnel channels while systematically starving the early-stage discovery mechanisms that introduce fresh prospects into the brand ecosystem. To capture high-value accounts, you must build a technical tracking architecture that maps out every touchpoint from initial discovery to final purchase.
Shifting your analytics strategy from broad speculation to forensic user-activity tracing requires deploying advanced measurement methodologies. By capturing data across every web session, file download, form submission, and checkout click, you gain deep insights into where users drop out of your funnel. This allows you to intentionally re-engineer your interface to capture lost opportunities, improve your overall acquisition efficiency, and maximize your customer lifetime value.
Deconstructing the Technical Foundations of Journey Tracking
To trace a consumer accurately across a multi-stage funnel, your website infrastructure must be configured to capture granular event data without degrading frontend performance or compromising user data privacy. Relying on default web analytics installations only provides aggregate pageview statistics, which fail to communicate the actual behavioral intent of your target market.
Modern event-driven tracking requires deploying data layers that dynamically capture custom interactions as they occur in real time. This means modifying your source code to monitor specific layout changes, click events, media interactions, and scroll benchmarks. Each event must pass unique contextual parameters—such as target element IDs, product SKUs, transactional values, and traffic sources—directly to a centralized analytics system.
Deploying these tracking systems requires a solid understanding of script optimization to avoid slowing down your site's rendering speeds. A poorly deployed analytics tag that relies on heavy JavaScript execution can easily freeze the browser's main thread, increasing your layout latency and driving users away before they ever complete their journey.
Deploying Client-Side and Server-Side Event Models
While client-side scripts remain the standard for tracking basic interactions like button clicks and mouse movements, modern ad-blockers, browser privacy adjustments, and tracking protection systems regularly block these scripts. This creates major gaps in your attribution reports, frequently misattributing organic traffic as direct visits or losing track of returning users entirely.
To prevent this data degradation, you must deploy a server-side tracking model alongside your traditional setup. In a server-side framework, your web server captures interaction data directly from the user's request stream and forwards it via secure API calls to your analytical databases. This architecture bypasses browser-level execution barriers, provides clean data security, and keeps your client-side page execution lightweight and efficient.
For example, when an enterprise intends to establish a baseline event capture loop for a form interaction without relying on bulky, automated tracking plug-ins, they can deploy customized event listeners within their clean source code layouts:
[User Action: Submit Form]
            │
            ▼
[Event Listener Captures Submit]
            │
            ▼
[Initialize window.dataLayer]
            │
            ▼
[Push Contextual Parameters]
  ├── event: 'lead_form_submission'
  ├── form_id: 'contact-form'
  └── journey_stage: 'consideration_evaluation'
            │
            ▼
[Data Sent to Analytics Database]
Implementing these programmatic tracking protocols ensures that your business collects highly reliable behavioral data. Mastering the clean integration of these event frameworks requires reviewing how to handle tracking organic visitors, heatmaps, and analytics pixel setup, providing your engineering team with the exact tools needed to eliminate blind spots in data tracking.
Mapping the Four Essential Journey Milestones
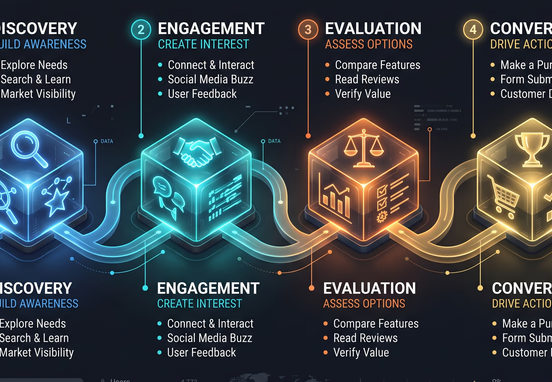
An effective tracking architecture breaks down the user experience into four distinct behavioral phases: Discovery, Engagement, Evaluation, and Conversion. The table below highlights the key metrics, technical event tags, and analytical goals required to audit each stage of the funnel:
| Journey Phase | Primary User Action | Technical Tracking Event | Core Success Metric | Optimization Objective |
|---|---|---|---|---|
| Discovery | Enters the domain via search or referral channels | session_start / first_visit | Organic Click-Through Rate | Maximize early keyword visibility and lower initial bounce rates. |
| Engagement | Interacts with foundational resource assets | scroll_depth / file_download | Average Session Duration | Enhance layout structure to drive deep content exploration. |
| Evaluation | Views pricing matrices or commercial pages | view_item / click_cta | Form Initiation Percentage | Minimize interface friction on high-value lead capture pages. |
| Conversion | Submits secure contact data or payment info | purchase / lead_form_submit | Average Transaction Value | Streamline checkout sequences to maximize total conversion revenue. |
As you analyze these operational metrics, look at how your business model alters the flow of information across your site. For instance, the tracking parameters, page layouts, and evaluation durations for an enterprise B2B service platform differ completely from a rapid consumer e-commerce checkout.
Reviewing how how B2B vs B2C positioning changes your website layout strategy helps you customize your conversion tracking setup to align with the specific decision-making timelines of your target audience.
The Nuances of Multi-Session Stitching
When a user discovers your brand on a smartphone during a mobile search session, returns via a desktop computer through a direct bookmark three days later, and finally converts via an email newsletter link, you must link these separate events into a unified customer journey record. Failing to stitch these sessions together results in your data treating a single human customer as three separate users.
To fix this, utilize persistent client identifiers and securely hashed authentication keys within your application backend. When a visitor registers for a webinar or downloads an industry report, your platform associates their unique identifier with their historical anonymous cookie data. This matches their cross-device interactions into a single comprehensive timeline, giving you an accurate look at true customer acquisition timelines.

Advanced Attribution Modeling and Data Cleanliness
Once your infrastructure collects clean interaction data across all touchpoints, you must select an attribution model to evaluate the financial performance of your marketing channels. Using a basic last-click attribution model awards 100 percent of the conversion value to the final link clicked before purchase, which creates distorted performance reports.
If an informational blog article captures a user's attention and introduces them to your brand, but they later convert by typing your name directly into a search engine, last-click models will mark your organic search efforts as a zero-value asset. This flawed data can lead you to shut down highly profitable top-of-funnel content campaigns.
To avoid this, implement position-based or data-driven attribution models. A position-based framework assigns 40 percent of the conversion credit to the initial discovery touchpoint, 40 percent to the final conversion action, and distributes the remaining 20 percent across the middle nurturing interactions. This approach respects the long-term compounding value of your top-of-funnel content assets while still rewarding your conversion-focused layouts.
Data Validation Tip: Always implement clean parameters for every external marketing link you distribute. If you drop unstructured links into social platforms or email copy without standardized tracking parameters, your traffic reports will miscategorize that high-value referral traffic as generic "Direct" visits, destroying the accuracy of your journey maps.
A high bounce rate or an immediate drop-off during the transition from the evaluation phase to the conversion step indicates that your site layout introduces too much friction or fails to build baseline brand authority. Understanding how great user experience lowers customer acquisition costs outlines how optimization choices directly reduce user drop-offs, maximizing the return on your top-of-funnel traffic generation efforts.

Aligning Tracking Architecture with Site Infrastructure
Building a beautiful web interface to trace your customer journey is a wasted investment if your site infrastructure is slow, clunky, or prone to rendering errors. When users encounter slow loading speeds or visual layout shifts during critical evaluation milestones, they will quickly abandon their journey and turn to your competitors.
To prevent this abandonment, your digital platform must be engineered with speed and technical optimization as a top priority. Our dedicated optimized web design and development service focuses on building clean, hand-coded frameworks that load almost instantly and function flawlessly across all devices. This ultra-fast performance removes technical friction from the user experience, allowing your tracking tools to record clean, natural user behavior across your entire sales funnel.
Furthermore, a clean, custom code layout eliminates the heavy script debt, bloated CSS files, and broken plugin dependencies common in generic page builders. This lightweight code environment ensures that when you deploy advanced event tracking scripts and analytics tags, your site's loading speed remains uncompromised, allowing you to collect actionable business intelligence while maintaining a premium user experience.
Evaluating Conversion Performance Across the Completed Journey
The ultimate goal of tracking your customer journey is to find the exact points of user drop-off and systematically increase your overall site conversion rate. When you have access to clean, end-to-end attribution metrics, you stop relying on industry guesswork and start making layout adjustments driven by hard user data.
If your tracking system reveals that your site maintains high engagement rates but suffers from low conversion rates at the final checkout or form submission step, you must audit your transaction forms for technical errors or excessive fields. Understanding what is a good conversion rate for a hand-coded website provides your team with an objective performance baseline, allowing you to benchmark your platform's conversion numbers against modern web development standards.
Regularly monitor your analytics dashboards to track your primary conversion paths, identify content pages that trigger high bounce rates, and confirm that your multi-device session stitching continues to function without errors. By building a fast, secure, and fully tracked digital asset, you can trace exactly how a user moves from their initial discovery search to their final purchase, giving you the real-world data needed to scale your business operations effectively.